このページの内容は、「K 値で読み解くCOVID-19の感染状況と今後の推移」からの抜粋です。詳細は上記論文を御一読されることをお勧めします。
なお、K値に関する解説動画もこちらにあります。
日本におけるK値の推移について
論文中で示したとおり日本における K 値の推移は極めて安定で、ヨーロッパのいくつかの国で見られたような社会活動の制限等の施策による感染収束速度の増加もなければ、米国で見られるような感染再拡大の兆候も見られない。4 月 3 日から 24 日にかけては、傾きが-0.0283の直線でよく近似され、それ以降の推移も k=0.9185 の予想線に沿って推移している。このまま順調な推移が継続すれば、5 月中旬には多くの国で感染収束宣言が出ているレベルであるK=0.05に達するであろう。
次の図 3 に直線によるフィット、そのフィット結果から求めた 4 月 25 日以降の予想曲線と観測値を示す。d=0 が 4 月 1 日に対応し、d=30 が 5 月 1 日に対応する。
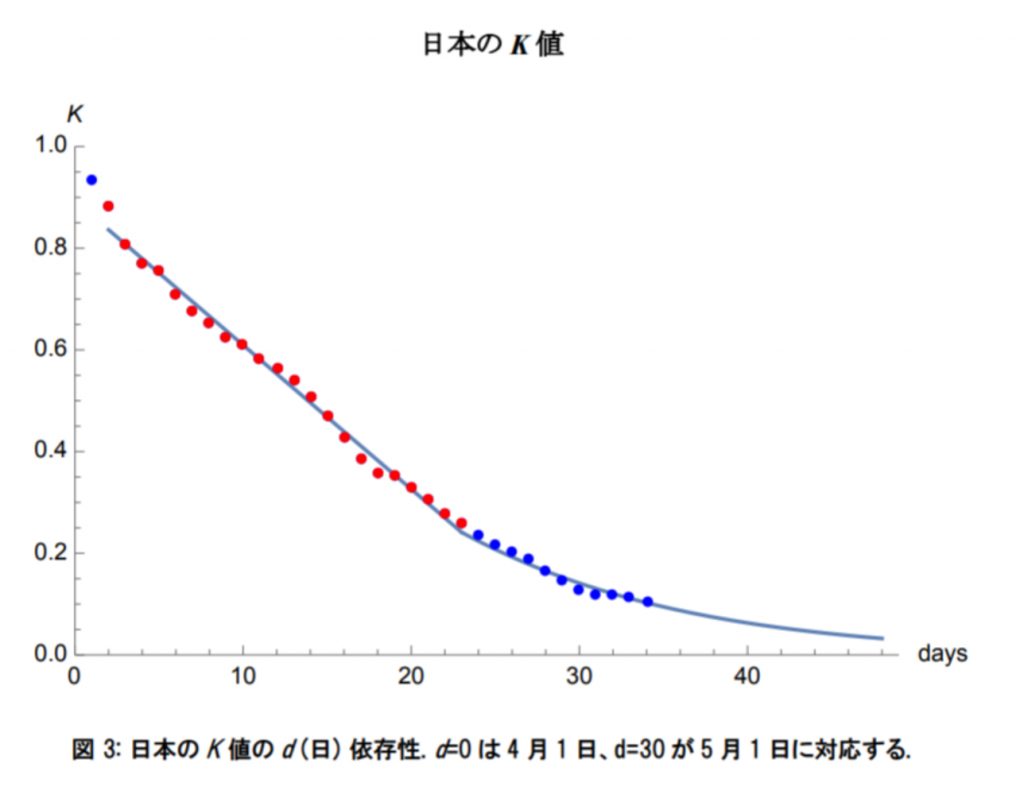
Changes in K value in Japan
As shown in the paper, the transition of K value in Japan is extremely stable. There is no increase seen in the United States nor an infection rate convergence due to measures such as the restriction of social activities seen in some European countries. There is no sign of such re-infection. From April 3 to 24, the slope is well approximated by a straight line of -0.0283, and the subsequent trends have also followed the expected line of k = 0.9185. If the situation continues smoothly, it will reach K = 0.05, in mid-May , the level at which declarations of convergence of infection have been issued in many countries.
Figure 3 below shows a straight line fit, the forecast curve obtained from the fit results and the observed values after April 25 . d = 0 corresponds to April 1st and d = 30 corresponds to May 1st.